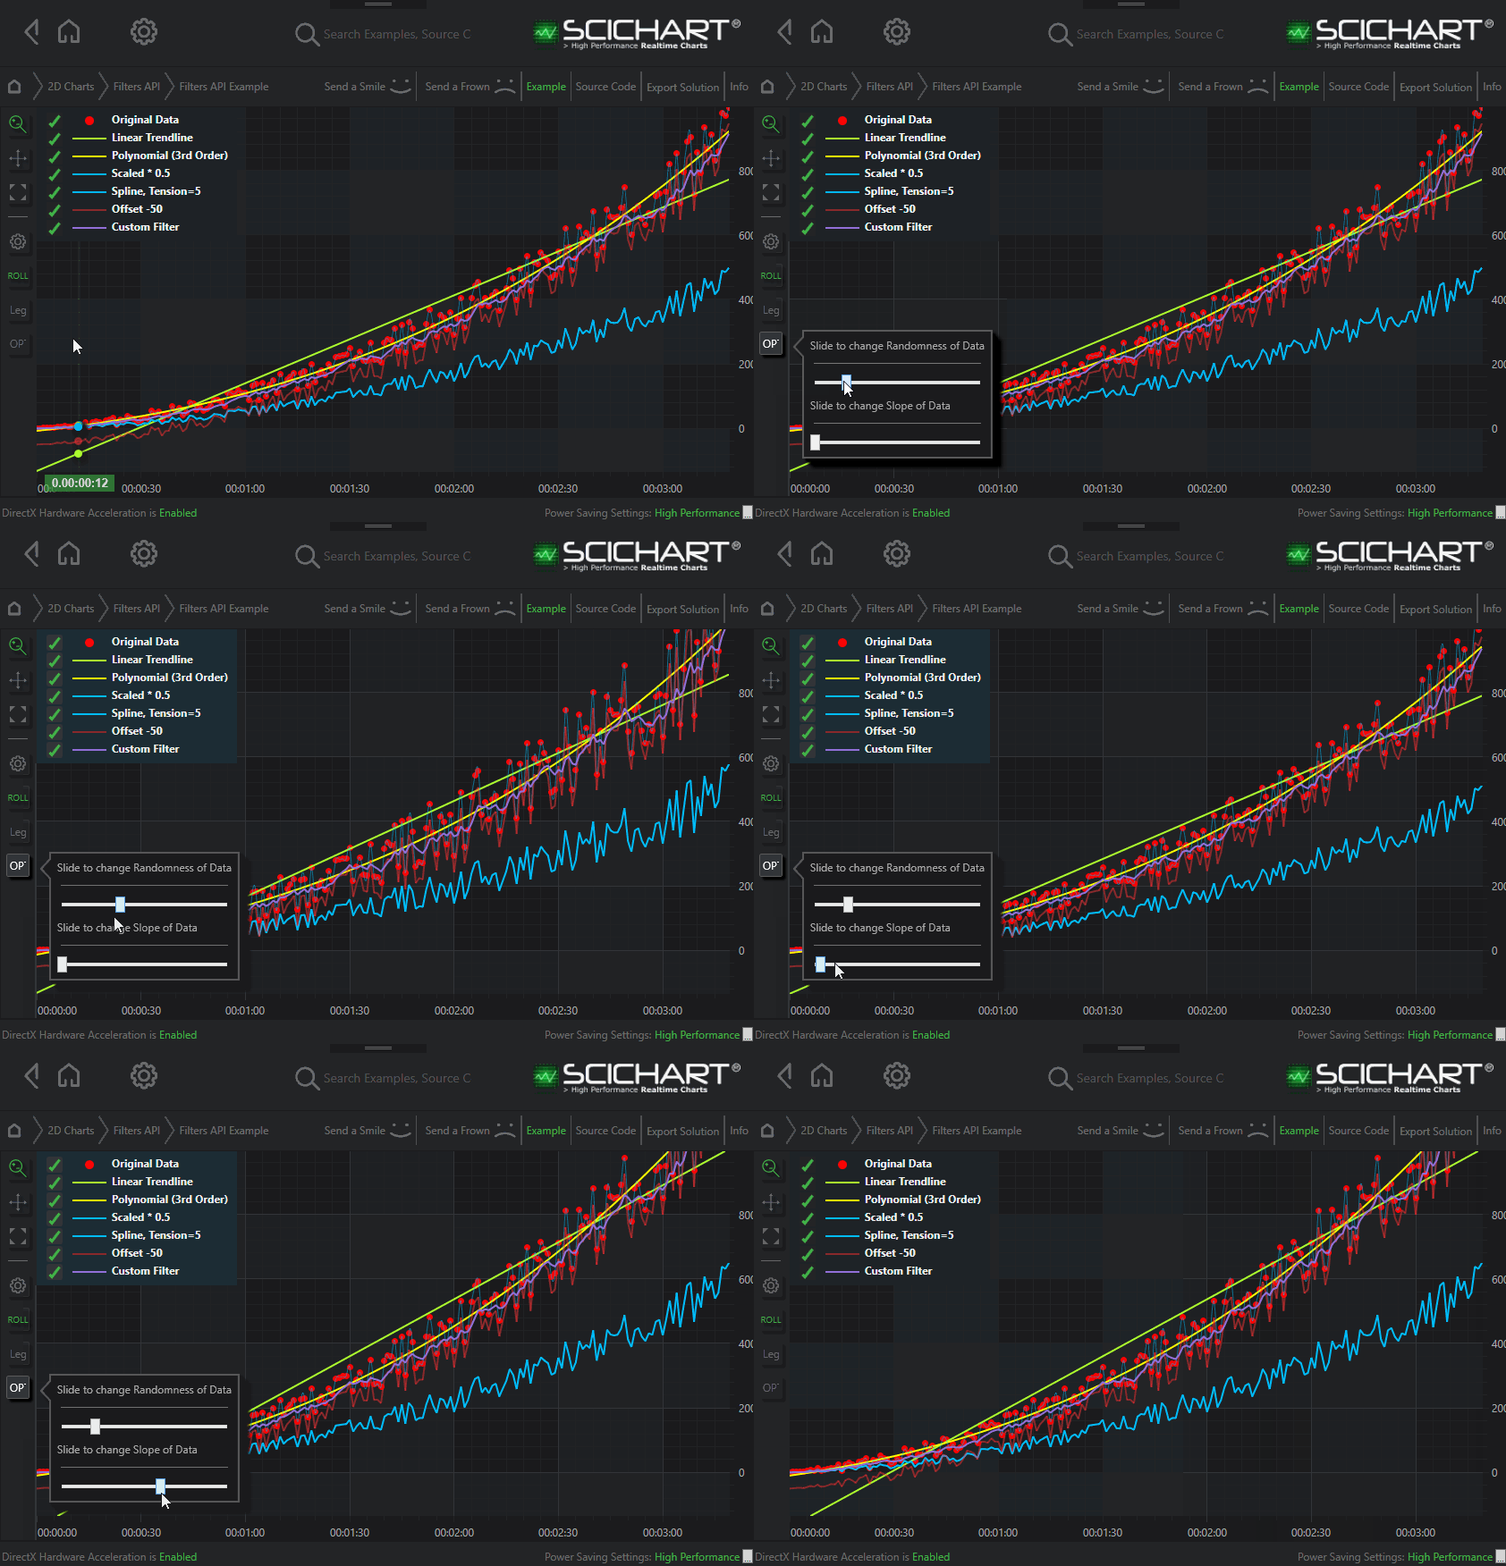
The Filters and Function API was added to SciChart WPF v5 as a way to create derived data, filters, indicators or perform functions on your data easily and simply.
SciChart comes with a number of filters built-in. The Filters API can be used easily where you want to
- Add a Linear Trendline to a chart
- Add a Polynomial Trendline to a chart
- Spline interpolate your data to get a smoothed plot
- Perform Low-Pass or High-Pass filtering
- Perform a Moving Average on an underlying DataSeries
- Offset or Scale a data-series
- Perform custom filtering or data transformation operations on your data.
The Filters API is also extremely configurable and allow you to create custom filters - the possibilities of this API really are endless!
Have a look at the video below to show you in more detail what this API is and how you can use it in your applications.
Filters Built-in to SciChart WPF
A number of filters are built-in to the SciChart.Charting library. To use these, we use the Extension Methods in the SciChart.Charting.Model.Filters namespace. Import the namespace using SciChart.Charting.Model.Filters then use one of the following examples below to filter your data.
- Scale, Offset Filters
- Linear Trendline, Polynomial Trendline Filters
- Spline Interpolation Filters
- Moving Average Filters
- Custom Filters
Updating Data with Filters
The beauty of the Filters API is that when the underlying data updates, the filter automatically updates. There is no need to recalculate your filter - SciChart does this for you!
For example, in the WPF Chart Example 'Filters API', we demonstrate a single dataseries with multiple filters. Sliders change the original data. All filters automatically update and the chart updates!

Daisy-Chaining Filters
Fitlers may be daisy chained or cascaded in order to combine their effects. Changing the underlying DataSeries will cause all filters in the chain to trigger an update.
A note about memory usage
While the Filters API is powerful, we want to make you aware about the memory usage. Each filter creates a copy of a dataseries to store the derived data. This mens that for a 100,000 points DataSeries with one filter applied, 200,000 points are stored in memory.
For TX=Double, TY=Double the total amount of memory required is therefore 200,000 * 8 * 2 = 3.2MBytes (vs. 1.6MBytes for the original data).
Some fitlers use a lot more memory such as the Spline Interpolation filter. With a spline resolution of 5, the derived dataseries will use 5x more memory than the original data-series.
For most applications this won't be a problem, but it's something to bear in mind when filtering your data.
